Jump To:
Available report types
How to configure the template of a report type
How to configure the company information
How to create a report step-by-step
How to Create a PDF Report
Generating a PDF report
How to Create a Quantifier Report
Importing a cost file as codelist
Measuring features for quantification
Generating a quantifier report
Available report types
The following report types are available:
- Checks
- Verification
- Data Collection
- GNSS Base Setup
- GNSS Setup
- GridLogging
- Quantify
- Roading
- Stakeout
- TPS Setup
- Volume
☞ You can configure the template of a report type according to your needs. Refer to How to configure the template of a report type.
☞ GridLogging is only available with the Surface Pilot licence. Verification is only available with the Point Cloud licence.
How to configure the template of a report type
- Select Reports from the Home screen/Admin Panel.

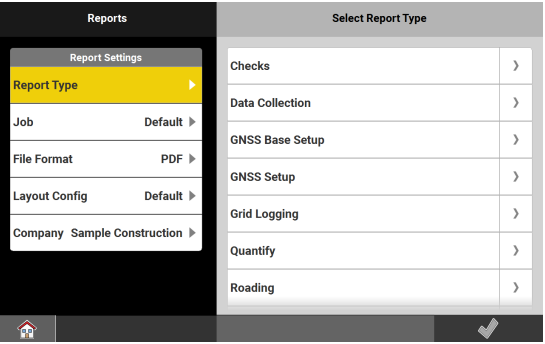
- To configure the template of a report type, tap the arrow button
 beside the name of the report type.
The column selection screen for the respective report type is displayed.
☞ The screenshot shows an example for Checks. Other applications have different values to select/show.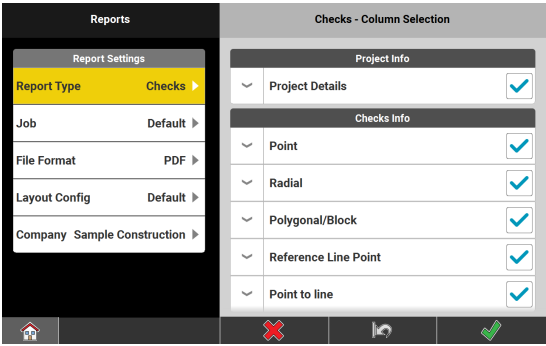
- To display or hide the available columns of an information type, tap the down/up arrow.
- To select or deselect the desired columns to be displayed, tap
the check box of the respective column names. - Tap
 .
.
- To select or deselect the desired columns to be displayed, tap
- To save the changes of the report template, tap
 .
.
How to configure the company information
It is possible to configure the report to include a specific logo, address, contact details and footer. You can create several company profiles and apply them to the report as needed.
- Select Reports from the Home screen/Admin Panel.
- To create, edit or delete a company profile, tap Company.
The Select Company screen is displayed.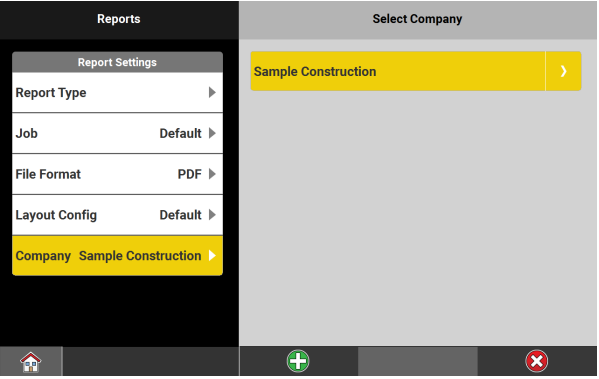
- To edit an existing company profile, tap the arrow button beside the company name.
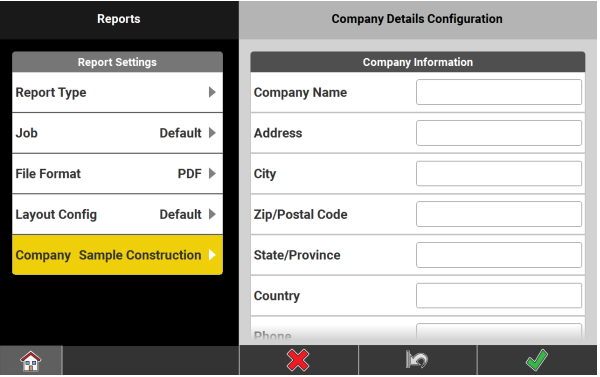
The Company Details Configuration screen is displayed.- To create a company profile, tap
 .
.
The Company Details Configuration screen is displayed.
- To create a company profile, tap
- Enter the necessary information below Company Information.
- Enter at least a company name.
- To clear all entries, tap
 .
.
- To delete the selected company profile, tap
 .
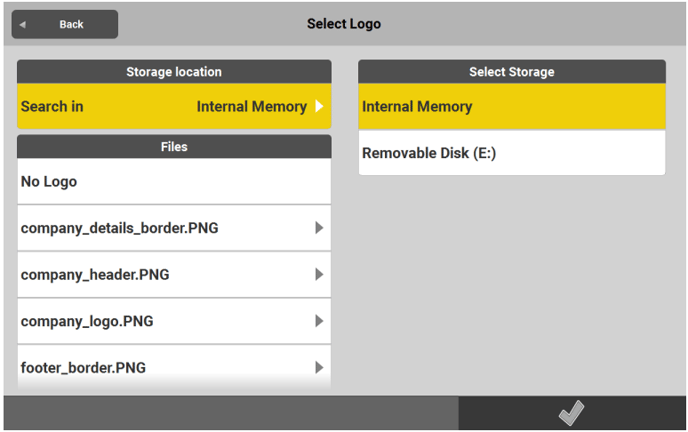
. - You can add a company logo as .jpeg or .png file. Save such files in the internal memory or in the root directory of a removable data storage device. Logo size:
- Minimum: 10 x 10 pixels
- Maximum: 102 x 1024 pixels
- To add a company logo, scroll down to Company Logo.
- To display the available files, tap Company Logo.
- To set the source of the logo file, tap Search in.
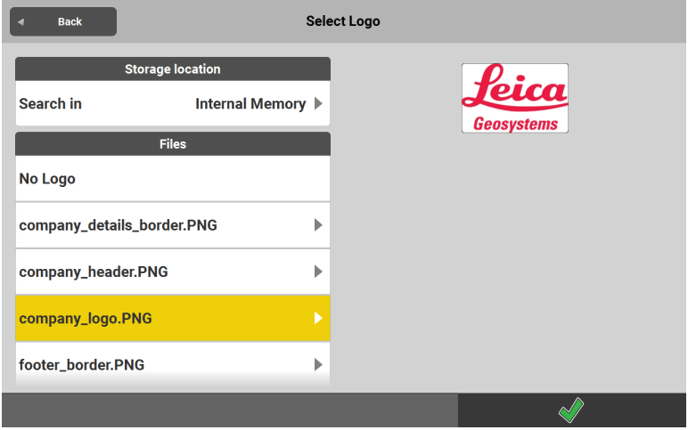
- To display the preview of a logo file, tap the file name.
- To select the displayed logo file, tap
 .
.
- You can add a footer as .jpeg or .png file. Save such files in the internal memory or in the root directory of a removable memory device. The procedure is the same as for a company logo. Footer size:
- Minimum: 300 x 1500 pixels
- Maximum: 10% of the height of the text or width size
- To save the company profile, tap
 .
.
The company profile is automatically selected for use in the next report.
How to create a report step-by-step
- Select Reports from the Home screen/Admin Panel.
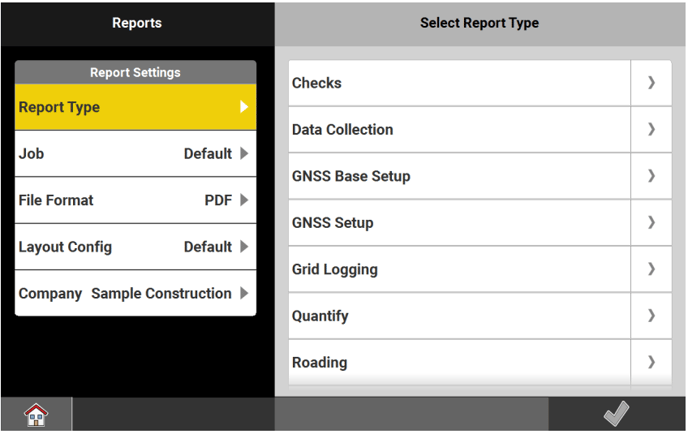
The currently active report settings are displayed. - To start creating a report, tap the desired report type.
- TPS Setup respectively GNSS Setup and GNSS Base Setup can only be used onboard a TPS with display, or on the controller with the appropriate instrument being
connected.
- TPS Setup respectively GNSS Setup and GNSS Base Setup can only be used onboard a TPS with display, or on the controller with the appropriate instrument being
- The current active job is selected by default.
Tap Job to select another job containing the data for the report. - To define the desired file format of the report, tap File Format.
Available file formats:- TXT, CSV, PDF and HTML
- For TPS onboard: TXT, CSV and HTML
- To define the layout of a report in PDF or HTML format, tap Layout Config.
- For information on configuring the layout for PDF data, refer to 2.3.2 How to Create a PDF Report.
- To select the desired company profile, tap Company.
- To create the report, tap
 .
.
- Depending on the report type, more settings are displayed.
- For Data Collection, GNSS Base Setup, GNSS Setup, Quantify, Roading, Stakeout or TPS Setup no additional settings are required. TPS setups can be added with standard deviation. Proceed to the next step.
- For Checks, GridLogging, Volume and Verification, a list with all available data is shown. Select the packages to be included in the report.
- For Volume: If it is sufficient to get an idea of the coordinates and to have short report in the end select Five Points instead of All Points.
- For Verification: If it is not necessary to show all extrema points in the report, select Ten Points instead of All Points.
- Tap to accept.
- Depending on the report type, more settings are displayed.
- Select the storing location.
- Apart from the Internal Memory, reports can be stored to a user-defined path, to a removable data storage device or to a Cloud service if included in your licence.
- The location can be either the global Reports folder or the Reports folder within a project.
- In the Save screen, you may change the default name to a userentered one.
- To accept and save the report, tap .
- Depending on the file format selected, a preview is shown of what is stored as Report file.
Tap to accept.
The file is created at the chosen location. - If the report template is configured to include images, the report file and the images linked to the points are exported together into the same directory. The images are in the subdirectory "CapturedImages".
- Depending on the file format selected, a preview is shown of what is stored as Report file.
How to Create a PDF Report
PDF is a special type of report that allows you to export selected information in a nice layout.
The PDF report is printable but not editable.
For Checks and Surfaces & Volumes, the tables are shortened. Any information about prism/antenna height, codes, satellites, quality and similar is not shown. If this information is needed, create a report in another file format or create a Data Collection report.
Necessary driver
For controllers delivered with v5.0 or higher, the necessary driver is already installed.
For controllers upgraded to v5.0 or higher, download and install the necessary driver (Component_PDFReports.exe) from myWorld under the relevant section for your controller.
☞ Before installing the driver, make sure that iCON is not running
Generating a PDF report
- Select Reports from the Home screen/Admin Panel.
- The currently active report type is displayed.
- Tap Job to select another job containing the data for the report.
- The current active job is selected by default.
- Select PDF as file format.
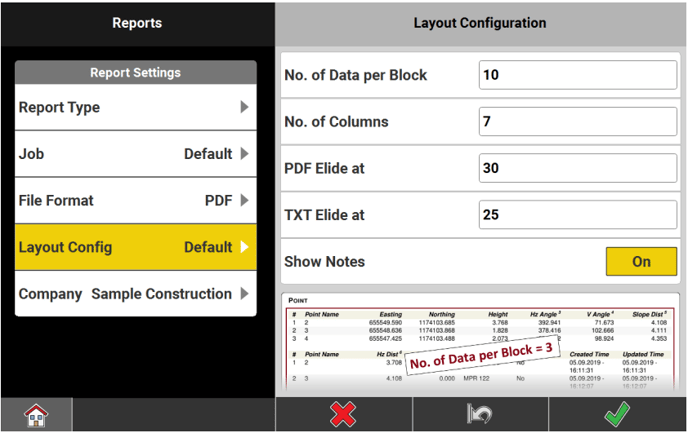
- Configure the layout:
Tap Layout Config- No. of Data per Block: In the report, the information for a point is broken up into several lines. Define the number of points for which all information is shown before a new block of points begins.
- Example: When using 10, all information of the first 10 points
shown in one block
- Example: When using 10, all information of the first 10 points
- No. of Columns: Define the number of columns. Up to 9 columns can be configured.
- PDF Elide at and TXT Elide at: Define the maximum number of characters shown per column.
- Default for PDF: 30, default for TXT Elide: 25
- If an entry exceeds the defined number of characters, "..." is
added.
- To cancel the configuring process, tap
 .
. - To reset to default settings, tap
 .
. - To accept, tap
 .
.
- No. of Data per Block: In the report, the information for a point is broken up into several lines. Define the number of points for which all information is shown before a new block of points begins.
- To select the desired company profile, tap Company.
- Tap .
- A preview is shown of what is stored as report file. Tap .
- Select the storing location.
- You may change the default name to a user-entered one.
- Tap .
How to Create a Quantifier Report
Quantify is a special type of report that allows you to attribute costs to surveyed points, lines, areas and volumes. Based on an imported cost file, the software calculates the job costs according to the quantity of surveyed features and the accordingly defined prices.
Cost file
A cost file contains the following information:
- Code
- Name of the code. The name stands for the survey feature to which the code is applied.
- Description
- Further description of the code.
- Cost
- Cost rate for the survey feature. Such rates are normally defined by contract.
- Entity Code
- Type of entity to be used for quantifying. See code explanation in the header of the cost file.
- Example: If a line is measured using a code specified for the entity "point", the line is not taken into account in the Quantifier report.
- Attribute
- Up to 25 attributes can be defined for a code.
Basic steps for generating a Quantifier report
- Start a new job.
- Import a cost file containing the necessary codes for quantification.
- Survey the applicable features to be included into the Quantifier report by assigning the respective codes.
- Generate and export a Quantifier report based on the contents of the job.
Importing a cost file as codelist
☞ A sample cost file (sample pricelist_comma.csv) is included in the system folder: "...\Documents\Leica Geosystems\iCON\Codes".
- Save a copy and edit the cost file (*.csv) to your needs.
- Import the cost file as a codelist.

- For information on importing data, refer to 2.2 Import, Export, or Delete Data.
- After import, edit the currency settings according to your needs. Go to Settings > Units & Tolerances.
- Tap Currency and enter the currency name.
- Tap
 to save changes.
- Tap
Measuring features for quantification
There are two options to include measured features in the quantification process:
- Automatic quantification
- Measured features are automatically included by assigning a code to the measured feature.
- This option applies to points, lines, polylines measured with a line code, and closed polylines measured with an area code.
- User-defined quantification
- Measured features are added manually when generating the Quantifier report.
- This option applies to areas and volumes. Refer to Generating a quantifier report.
Automatic quantification
- Create a new job.
- In the "Create new job" wizard, activate the imported code list for quantification.
- Open the desired application for measuring points, lines, polylines or
areas.- Map screen is displayed
- Configure the Measure bar to display Code. Refer to Measure bar.
- Before measuring a feature, assign the respective code from the cost file to include the feature in the quantification process. Tap Code in the Measure bar and select a code from the list. For detailed information, refer to Defining Code for Each Stored
Point .- When all applicable items are measured, you can generate a Quantifier report. Refer to Generating a quantifier report.
- Ensure that the active job contains the imported cost file.
Generating a quantifier report
- Select Reports from the Home screen/Admin Panel.
- Following screen is displayed:

- Ensure that the selected job contains Quantify data. If the selected job does not contain the required data, tap Job to select another job containing the data for the report.
- Following screen is displayed:
- Select the desired file format.
- To start creating the report, select Quantify and tap
 to accept.
The screen for data selection is displayed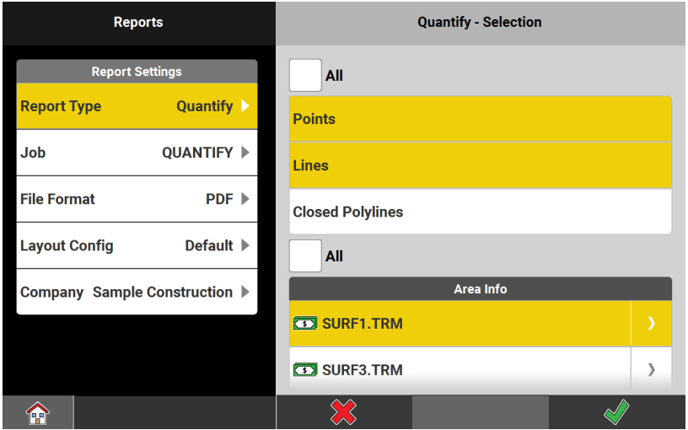
- Select a line to add the information to the report.
- To select or deselect all list items, tap All.
- To enable correct quantification of areas and volumes, assign a code
from the cost file:- Tap the arrow button
 beside the name of the respective area
or volume.
Following screen is displayed: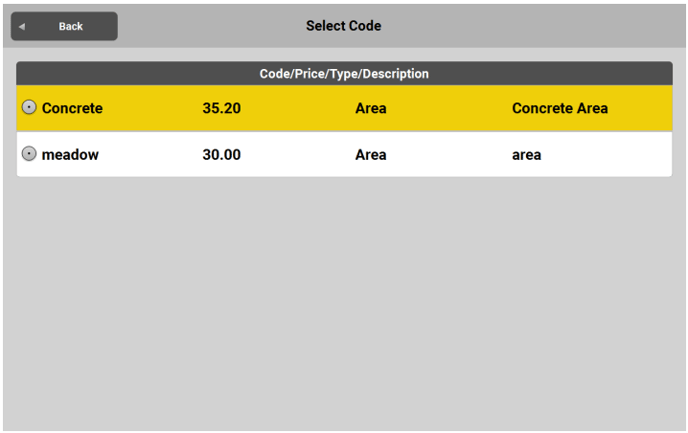
- Tap the desired code.
- The screen for data selection is displayed again. A symbol beside the name of the area or volume indicates that a code is assigned.

- Tap the arrow button
- Tap when finished with data selection.
- Select the storing location.
- You may change the default name to a user-entered one.
- Tap .
- The data storage device can be the internal memory or a removable data storage device.
- The location can be either the global Reports folder or the Reports folder within a project.
- The report is created at the chosen location.